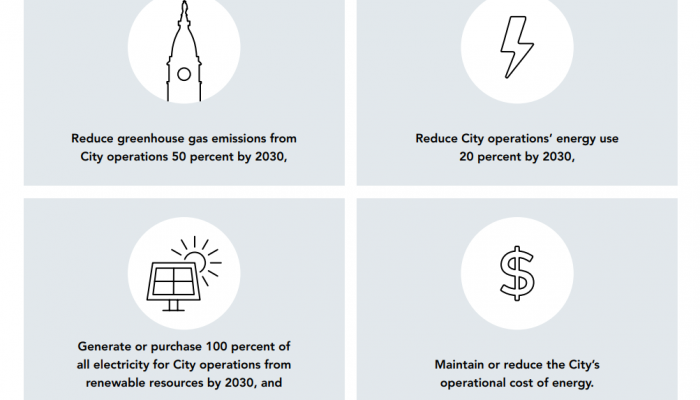
Earlier this year, the City of Philadelphia released a 2020 Progress Update on the Municipal Energy Master Plan. The report highlights progress towards meeting the City’s four main institutional energy and climate goals:
- reducing energy use,
- expanding renewable energy,
- lowering carbon pollution, and
- reducing energy costs in municipal operations.
The top highlight from the report is that a preliminary emissions inventory shows a 33 percent decrease in carbon emissions from the 2006 baseline, which puts the City on track to meet its goal of reducing carbon pollution caused by city facilities and street lighting 50 percent by 2030.
Another highlight is the nearly completed energy efficiency project at the Philadelphia Museum of Art that is on track to exceed its targets for energy reduction, job creation, and inclusion of diverse businesses. Other successes include the Greenworks Sustainability Fund financed energy retrofit at Fairmount Park’s Greenland Nursery, and the Power Purchase Agreement signed by the City last year to buy electricity from a 70 megawatt solar power plant in Adams County, Pennsylvania.
In between Energy Office progress updates, you can keep track of continued progress through a recently-released online dashboard that shows how City-owned buildings use energy.
The dashboard tracks and displays energy use for buildings whose operations are paid for from the City’s General Fund, which excludes buildings managed by the Philadelphia Water Department and the Philadelphia International Airport.
What Is a Dashboard?
A dashboard is a visual tool that provides a high-level view of key data on a particular topic. It helps viewers understand the data better by showing it in a format that is easy to understand. Dashboards generally provide a snapshot at a given point in time, and they are updated as new data becomes available.
What the Municipal Energy Use Dashboard Shows
The Municipal Energy Use Dashboard shows several metrics by which energy use in the city is measured and tracked. These metrics are used to measure progress towards the goals of the Municipal Energy Master Plan. The data is dynamic and is updated as utility bills are received.
EUI & Monthly MMTBU Usage shows the ratio of total energy used in all General Fund buildings to the total square footage of those buildings (known as energy use intensity or EUI) in the line chart. The bar chart displays monthly energy usage in MMBTUs by commodity (electricity, natural gas, steam, heating oil). This helps users compare how energy use for buildings changes over time. For example, the dashboard shows that energy use is cyclical and is affected by the change in seasons, much like it is in your own home.
Monthly Energy Use displays the total monthly energy use for all of the General Fund buildings, broken out by fiscal year. Energy is measured in MMBTUs (one million British Thermal Units), the standard U.S. unit of measure of the heat content of energy sources. One British Thermal Unit is roughly equal to the energy released by burning a match.
Total Energy Use by Commodity shows the total quantity of each type of energy source—electricity, natural gas, heating oil, and steam—used by General Fund buildings over the last 12 months.
Highest Energy Users shows which City departments and buildings used the most energy over the 12 most recent calendar months.
ENERGY STAR Scores display the current scores for General Fund buildings that are eligible for ENERGY STAR scores. ENERGY STAR for Commercial Buildings is a program run by the U.S. Environmental Protection Agency that allows building owners and managers to track the energy performance of their building against similar buildings across the country, on a scale of 1-100. A score of 50 represents median performance, while a score of 75 or higher means the building is a top energy performer. These scores update annually as data is gathered for citywide benchmarking compliance.